Analysis: How well have climate models projected global warming?
05.10.2017 | 5:00pm
Scientists have been making projections of future global warming using climate models of increasing complexity for the past four decades.
These models, driven by atmospheric physics and biogeochemistry, play an important role in our understanding of the Earth’s climate and how it will likely change in the future.
Carbon Brief has collected prominent climate model projections since 1973 to see how well they project both past and future global temperatures, as shown in the animation below. (Click the play button to start.)
While some models projected less warming than we’ve experienced and some projected more, all showed surface temperature increases between 1970 and 2016 that were not too far off from what actually occurred, particularly when differences in assumed future emissions are taken into account.
How have past climate models fared?
While climate model projections of the past benefit from knowledge of atmospheric greenhouse gas concentrations, volcanic eruptions and other
radiative forcingsaffecting the Earth’s climate, casting forward into the future is understandably more uncertain. Climate models can be evaluated both on their ability to hindcast past temperatures and forecast future ones.
(Note, these model/observation comparisons use a baseline period of 1970-1990 to align observations and models during the early years of the analysis, which shows how temperatures have evolved over time more clearly.)
Sawyer, 1973
One of the first projections of future warming came from
John Sawyer at the UK’s Met Office in 1973. In a
paper published in Nature in 1973, he hypothesised that the world would warm 0.6C between 1969 and 2000, and that atmospheric CO2 would increase by 25%. Sawyer argued for a
climate sensitivity – how much long-term warming will occur per doubling of atmospheric CO2 levels – of 2.4C, which is not too far off the
best estimate of 3C used by the Intergovernmental Panel on Climate Change (IPCC) today.
Unlike the other projections examined in this article, Sawyer did not provide an estimated warming for each year, just an expected 2000 value. His warming estimate of 0.6C was nearly spot on – the observed warming over that period was between 0.51C and 0.56C. He overestimated the year 2000’s atmospheric CO2 concentrations, however, assuming that they would be 375-400ppm – compared to the actual
value of 370ppm.
Broecker, 1975
The first available projection of future temperatures due to global warming appeared in an
article in Science in 1975 published by Columbia University scientist
Prof Wally Broecker. Broecker used a
simple energy balance model to estimate what would happen to the Earth’s temperature if atmospheric CO2 continued to increase rapidly after 1975. Broecker’s projected warming was reasonably close to observations for a few decades, but recently has been considerably higher.
This is mostly due to Broecker overestimating how CO2 emissions and atmospheric concentrations would increase after his article was published. He was fairly accurate up to 2000, predicting 373ppm of CO2 – compared to actual Mauna Loa observations of 370ppm. In 2016, however, he estimated that CO2 would be 424ppm, whereas
only 404 pm has been observed.
As with Sawyer, Broecker used an equilibrium climate sensitivity of 2.4C per doubling of CO2. Broecker assumed that the Earth instantly warms up to match atmospheric CO2, while modern models account for the lag between how quickly the atmosphere and oceans warm up. (The slower heat uptake by the oceans is often referred to as the “
thermal inertia” of the climate system.)
You can see his projection (black line) compared to observed temperature rise (coloured lines) in the chart below.
Projected warming from Broecker 1975 (thick black line) compared to observational temperature records from NASA, NOAA, HadCRUT, Cowtan and Way, and Berkeley Earth (thin colored lines) from 1970 to 2020. Baseline period of 1970-1990. Chart by Carbon Brief using Highcharts.
Broecker made his projection at a time when scientists widely thought that the observations
showed a modest cooling of the Earth. He began his article by presciently stating that “a strong case can be made that the present cooling trend will, within a decade or so, give way to a pronounced warming induced by carbon dioxide”.
Hansen et al, 1981
NASA’s
Dr James Hansen and colleagues
published a paper in 1981 that also used a simple energy balance model to project future warming, but accounted for thermal inertia due to ocean heat uptake. They assumed a climate sensitivity of 2.8C per doubling CO2, but also looked at a range of 1.4-5.6C per doubling.
Projected warming from Hansen et al 1981 (fast growth–thick black line–and slow growth–thin grey line). Chart by Carbon Brief using Highcharts.
Hansen and colleagues presented a number of different scenarios, varying future emissions and climate sensitivity. In the chart above, you can see both the “fast-growth” scenario (thick black line), where CO2 emissions increase by 4% annually after 1981, and a slow-growth scenario where emissions increase by 2% annually (thin grey line). The fast-growth scenario somewhat overestimates current emissions, but when combined with a slightly lower climate sensitivity it provides an estimate of early-2000s warming close to observed values.
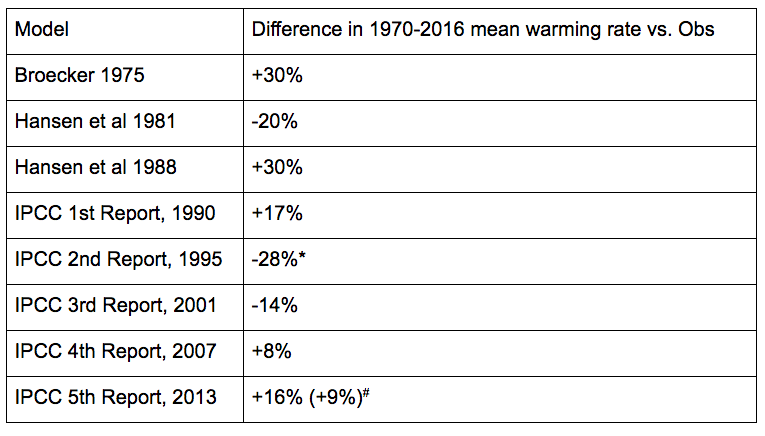
The overall rate of warming between 1970 and 2016 projected by Hansen et al in 1981 in the fast-growth scenario has been about 20% lower than observations.
Hansen et al, 1988
The
paper published by Hansen and colleagues in 1988 represented one of the first modern climate models. It divided the world into discrete grid cells of eight degrees latitude by 10 degrees longitude, with nine vertical layers of the atmosphere. It included aerosols, various greenhouse gases in addition to CO2, and basic cloud dynamics.
Hansen et al presented three different scenarios associated with different future greenhouse gas emissions. Scenario B is shown in the chart below as a thick black line, while scenarios A and C are shown by thin grey lines. Scenario A had exponential growth in emissions, with CO2 and other GHG concentrations considerably higher than today.
Projected warming from Hansen et al 1988 (scenario B–thick black line–and scenarios A and C–thin solid and dashed grey lines). Chart by Carbon Brief using Highcharts.
Scenario B assumed a gradual slowdown in CO2 emissions, but had concentrations of
401ppm in 2016 that were pretty close to the
404ppm observed. However, scenario B assumed the continued growth of emissions of various halocarbons that are powerful greenhouse gases, but were subsequently restricted under the
Montreal Protocol of 1987. Scenario C had emissions going to near-zero after the year 2000.
Of the three, scenario B was closest to actual radiative forcing, though still
about 10% too high. Hansen et al also used a model with a climate sensitivity of 4.2C per doubling CO2 – on the high end of most modern climate models. Due to the combination of these factors, scenario B projected a rate of warming between 1970 and 2016 that was approximately 30% higher than what has been observed.
IPCC First Assessment Report, 1990
The IPCC’s
First Assessment Report (FAR) in 1990 featured relatively simple energy balance/upwelling diffusion ocean models to estimate changes in global air temperatures. Their featured business-as-usual (BAU) scenario assumed rapid growth of atmospheric CO2, reaching 418ppm CO2 in 2016, compared to 404ppm in observations. The FAR also assumed continued growth of atmospheric halocarbon concentrations much faster than has actually occurred.
The FAR gave a best estimate of climate sensitivity as 2.5C warming for doubled CO2, with a range of 1.5-4.5C. These estimates are applied to the BAU scenario in the figure below, with the thick black line representing the best estimate and the thin dashed black lines representing the high and low end of the climate sensitivity range.
Projected warming from the IPCC First Assessment Report (mean projection–thick black line, with upper and lower bounds shown by thin dotted black lines). Chart by Carbon Brief using Highcharts.
Despite a best estimate of climate sensitivity a tad lower than the 3C used today, the FAR overestimated the rate of warming between 1970 and 2016 by around 17% in their BAU scenario, showing 1C warming over that period vs 0.85C observed. This is mostly due to the projection of much higher atmospheric CO2 concentrations than has actually occurred.
IPCC Second Assessment Report, 1995
The IPCC’s
Second Assessment Report (SAR) only published readily-available projections from 1990 onward. They used a climate sensitivity of 2.5C, with a range of 1.5-4.5C. Their mid-range emissions scenario, “IS92a”, projected CO2 levels of 405ppm in 2016, nearly identical to observed concentrations. SAR also included much better treatment of anthropogenic aerosols, which have a cooling effect on the climate.
Projected warming from the IPCC Second Assessment Report (mean projection–thick black line, with upper and lower bounds shown by thin dotted black lines). Chart by Carbon Brief using Highcharts.
As you can see in the chart above, SAR’s projections ended up being notably lower than observations, warming about 28% more slowly over the period from 1990 to 2016. This was likely due to a combination of two factors: a lower climate sensitivity than found in modern estimates (2.5C vs. 3C) and an overestimate of the
radiative forcing of CO2(4.37 watts per square meter versus 3.7 used in the subsequent IPCC report and still used today).
IPCC Third Assessment Report, 2001
The IPCC
Third Assessment Report (TAR) relied on atmosphere-ocean general circulation models (GCMs) from seven different modeling groups. They also introduced a new set of socioeconomic emission scenarios, called
SRES, which included four different future emission trajectories.
Here, Carbon Brief examines the
A2 scenario, though all have fairly similar emissions and warming trajectories up to 2020. The A2 scenario projected a 2016 atmospheric CO2 concentration of 406 ppm, nearly the same as what was observed. The SRES scenarios were from 2000 onward, with models prior to the year 2000 using estimated historical forcings. The dashed grey line in the figure above shows the point at which models transition from using observed emissions and concentrations to projected future ones.
Projected warming from the IPCC Third Assessment Report (mean projection–thick black line, with upper and lower bounds shown by thin dotted black lines). Chart by Carbon Brief using Highcharts.
TAR’s headline projection used a simple climate model that was configured to match the average outputs of seven more sophisticated GCMs, as no specific multimodel average was published in TAR and data for individual model runs are not readily available. It has a climate sensitivity of 2.8C per doubling CO2, with a range of 1.5-4.5C. As shown in the chart above, the rate of warming between 1970 and 2016 in the TAR was about 14% lower than what has actually been observed.
IPCC Fourth Assessment Report, 2007
The IPCC’s
Fourth Assessment Report (AR4) featured models with significantly improved atmospheric dynamics and model resolution. It made greater use of Earth System Models – which incorporate the biogeochemistry of carbon cycles – as well as improved simulations of land surface and ice processes.
AR4 used the same SRES scenarios as the TAR, with historical emissions and atmospheric concentrations up to the year 2000 and projections thereafter. Models used in AR4 had a mean climate sensitivity of 3.26C, with a range of 2.1C to 4.4C.
Projected warming from the IPCC Fourth Assessment Report (mean projection–thick black line, two-sigma upper and lower bounds shown by thin dotted black lines). Chart by Carbon Brief using Highcharts.
The figure above shows model runs for the A1B scenario (which is the only scenario with model runs readily available, though its 2016 CO2 concentrations are nearly identical to those of the A2 scenario). AR4 projections between 1970 and 2016 show warming quite close to observations, only 8% higher.
IPCC Fifth Assessment Report, 2013
The most recent IPCC report – the
Fifth Assessment (AR5) – featured additional refinements on climate models, as well as a modest reduction in future model uncertainty compared to AR4. The climate models in the latest IPCC report were part of the
Coupled Model Intercomparison Project 5 (CMIP5), where dozens of different modeling groups all around the world ran climate models using the same set of inputs and scenarios.
Projected warming from the IPCC Fifth Assessment Report (mean projection–thick black line, two-sigma upper and lower bounds shown by thin dotted black lines). Dashed black line shows blended model fields. Chart by Carbon Brief using Highcharts.
AR5 introduced a new set of future greenhouse gas concentration scenarios, known as the
Representative Concentration Pathways (RCPs). These have future projections from 2006 onwards, with historical data prior to 2006. The grey dashed line in the figure above shows where models transition from using observed forcings to projected future forcings.
Comparing these models with observations can be a
somewhat tricky exercise. The most often used fields from climate models are global surface air temperatures. However, observed temperatures come from surface air temperatures over land and sea surface temperatures over the ocean.
To account for this, more recently, researchers have created blended model fields, which include sea surface temperatures over the oceans and surface air temperatures over land, in order to match what is actually measured in the observations. These blended fields, shown by the dashed line in the figure above, show slightly less warming than global surface air temperatures, as models have the air over the ocean warming faster than sea surface temperatures in recent years.
Global surface air temperatures in CMIP5 models have warmed about 16% faster than observations since 1970. About 40% of this difference is due to air temperatures over the ocean warming faster than sea surface temperatures in the models; blended model fields only show warming 9% faster than observations.
A
recent paper in Nature by
Iselin Medhaug and colleagues suggests that the remainder of the divergence can be accounted for by a combination of short-term natural variability (mainly in the Pacific Ocean), small volcanoes and lower-than-expected solar output that was not included in models in their post-2005 projections.
Below is a summary of all the models Carbon Brief has looked at. The table below shows the difference in the rate of warming between each model or set of models and
NASA’stemperature observations. All the observational temperature records are fairly similar, but NASA’s is among the group that includes more complete global coverage in recent years and is thus more directly comparable to climate model data.
* SAR trend differences are calculated over the period from 1990-2016, as estimates prior to 1990 are not readily available.
# Differences in parenthesis based on blended model land/ocean fields
Conclusion
Climate models published since 1973 have generally been quite skillful in projecting future warming. While some were too low and some too high, they all show outcomes reasonably close to what has actually occurred, especially when discrepancies between predicted and actual CO2 concentrations and other climate forcings are taken into account.
Models are far from perfect and will continue to be improved over time. They also show a fairly large range of future warming that
cannot easily be narrowed using just the changes in climate that we have observed.
Nevertheless, the close match between projected and observed warming since 1970 suggests that estimates of future warming may prove similarly accurate.
Methodological note
 International climate treaties have been ineffective, the report said. Photograph: Josh Edelson/AFP/Getty Images